Saturday, 13 October 2018

Tax saving investments

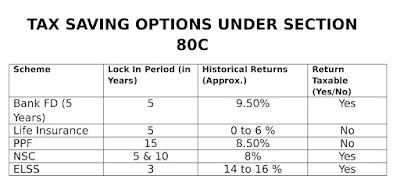
Tax-saving investment options can help you plan your annual savings. In this article I am going to discuss about the options which will help you to achieve your investment target.

•  Tax Saving Fixed Deposits


Different banks offer different interest rate on the tax saving fixed deposits which range from 6.5- 8.7%. These plans are almost same as the regular fixed deposits plans. Taxes saving plans are come with a lock in period of 5 years and tax break under Section 80C on investments up to Rs 1.5 lakh. These schemes are suitable for the senior citizens who look for the low risk investment plans. One thing must be noted here that interest is not taxable.

•  National Pension Scheme


It is usually known as NPS scheme. This scheme provides you an total tax saving benefit of Rs 2 lakh, 1.5 lakh under section 80C and Rs 50000 under section 80CCD (1B) of income tax act. To get this benefit you must have an investment account of National Pension Scheme. Please do visit on their website to know the more details and apply.

•  Equity linked Saving Scheme


For many people, the investment that should make most sense is an ELSS. Salary earners normally have some of the allowable amount going into fixed income through PF deductions. And, to balance that, equity is advisable. It is a unique investment plan which is only viable tax-saving investment within Rs 1.5 lakh limit that fetches the benefits of equity returns.

•   Life Insurance


Life Insurance can be considered as a default tax saving scheme used by the investors. It is covered under section 80C. The schemes of life insurance help a person to protect his or her family from any unpredicted incidents in the future and also giving the opportunity to save tax. Whereas the tax benefit can be reversed if anyone gives up the plan before 2 years.

•  National Saving Certificate


It is issued by post offices and principal along with interest is backed up by the Govt. of India. Therefore, these are known as safe investment options. Now NSC’s are available for 5 year period and for a minimum investment of Rs 500 and in multiples of Rs 1,000, Rs 5,000 or Rs 10,000. There is no maximum limit for investment. Interest rates will be 8% per annum for the 5 year NSC from 1.10.2018. This rate changes on a quarterly basis and published by the Ministry of Finance.

•    Unit Linked Insurance Plans


Unit Linked Insurance Plans are most common products in which investors put their money. These schemes not only provide insurance cover, but also a comprehensive form of investment. The invested amount in ULIPs is put into shares and customers have freedom to choose how much of their money must be invested in shares. These are highly tax efficient policies and get the benefits under Section 80C of the Income Tax Act. The amount you will get at the end is also tax free.
There are many more tax saving schemes available - Health Insurance, Rajiv Gandhi Equity Savings Scheme, Debt Based Mutual Funds, Public Provided Fund, Heath Insurance, Senior Citizens Saving Scheme and Employee Provident Fund etc.
Tax-Saving

Thursday, 12 July 2018

TruStage Insurance Agency

Insurance protection must be in your part of a solid financial plan. You never know when the accident knocks on your door. Trustworthy insurance coverage helps safeguards financial relief when you need it most. As long as the insurance coverage is with you, it means you can take comfort in knowing you’re secure.

TruStage Insurance Agency makes a range of insurance products and programs available to the members and helps you defend what matters most.

TruStage Life Insurance Options


1. Term Life Insurance: 


The term Life Insurance helps to protect your other family members from the loss of your income if you were to die suddenly. It certainly helps your family meet their financial needs from household expenditures to rentals in your absence. Term Insurance Plan provides large life insurance cover at reasonable prices.

2.  Whole Life Insurance:


A Whole Life Insurance gives guaranteed death benefits during the entire life of the policyholder. The coverage is comprehensive for as long as the insured lives, as long as the premiums are paid up and the policy is not surrendered. These insurance plans are mainly designed to provide to those who do not want a fixed term, but rather have insurance cover till whenever they meet their death.

3. Children’s Whole Life Insurance:


This insurance coverage offers your child the gift of a lifetime - a whole life insurance policy up to $50,000 that’s assured for life. Children's Whole Life insurance pays money upon the death of the insured and may also build cash value

Accidental death and dismemberment insurance:


This insurance pays you or your beneficiaries a set amount of money if your death or dismemberment due to the result of an accident. There are restrictions that make accidental death and dismemberment insurance far less beneficial to the insurer. $100,000 of coverage for $10-$15 per month.

Car Insurance: 


We know every car requires fuel and maintenance to serve you but you also need car insurance to protect your car and you if something unpleasant occurs. A car insurance policy is an essential factor which safeguards the flawless upkeep of your precious vehicle. The Trustage’s car insurance plans are specially designed to offer enhanced protection at affordable rates. This insurance coverage offers protection for your Car, Motorcycle, Boat or Watercraft, ATV or Off-Road Vehicles & Recreational Vehicle (RV).

Health Insurance: 


Health insurance helps you to provide financial support when your health is not well. Just like you select your home insurance or car insurance, you are allowed choose a plan and agree to pay a certain rate, or premium, each month. You are assured by the health insurer to receive a portion of total medical costs.

To get the more details and plans click here https://www.trustage.com

Saturday, 7 July 2018

Difference Between Fundamental Analysis and Technical Analysis

In the earlier days, fundamental analysis was the only Investment method' that was a given any credibility. But in the modern days, it is changed so much as the arrival of the high-speed computing system. The technical analysis is much easier to understand rather than the fundamental analysis. Nowadays many lodge investment companies and portfolio managers use the technical analysis than the fundamental analysis. People are using technical analysis than the fundamental analysis because it is much easier to calculate and it is very easy to determine nearest the entry and exit point. But it is very difficult in fundamental analysis to calculate the exact entry and exit point.

The market has changed a lot today. For that, we also need to change our strategies according to the modern trend. Your investments are moving based on the technical factor rather than the fundamental factors.

To become a successful investor you need to follow both the fundamental analysis and technical analysis. I always suggest you select the stocks and the sectors which are fundamentally very strong and then select technical analysis to decide whether to buy that stock or not.

What is the fundamental analysis?


Fundamental Analysis is a method, with this method you can evaluate the value of the underlying company. Basically, we do a fundamental analysis to understand the economic conditions and the industry along with the company’s financial condition and management performance. You can understand this by reading the balance sheet, the profit and loss statement, financial ratios and other data that could be used to forecast the future of a company. Generally, we use the real data to analyze a stock’s value. Fundamental analysis uses, book value, return on equity, earnings, revenues, future growth, profit margins and other data to define a company's underlying value and prospects for future growth.  The thinking behind the fundamental analysis is that as the company grows so will the value of the shares increase.

What is technical analysis?


Technical analysis started out with pretty simple concepts. Earlier, it was about looking for directional trends in prices and divergences between related market indexes.  At the time the stock prices start moving in one direction either upper or lower, and then they are more likely to follow that trend than to reverse. Technical analysis was just a way to visualize this perception.

Fundamental analysis and technical analysis they have different goals. Fundamental Analysis mainly focuses on long-term investment what is the technical analysis mainly focuses on short-term and mid-term investment. 

Do you trade technical or fundamentals?


It completely depends on you, whether you are a short term, long term or medium term investor. If you are a medium term or short term trader then the possibility is that you are looking for technical analysis and rather than the fundamental analysis. Because if you follow the technical analysis then you will be able to act quicker after watching the chart pattern. Because if you are trading for the short term of little then you should not always look for the entry and exit point only. You should also look for the stop-loss point.

Long-term investors always look for the fundamental analysis more than the technical analysis. Long-term investors also look for the technical analysis to know the stock Trend whether it is in uptrend or downtrend. As a long-term investor, there is little more time available for considering all other factors

Fundamental Analysis Tools (discussed here at https://investmenttipstoday.blogspot.com/2018/04/fundamental-analysis-of-stocks.html)


•    Earnings Per Share
•    Price to Earnings Ratio (PE Ratio)
•    Price to Sales Ratio (PS Ratio)
•    Dividend Payout Ratio:
•    Book Value:
•    Return on Equity:

Technical Analysis factors (discussed here at https://investmenttipstoday.blogspot.com/2018/04/technical-analysis-of-stocks-commodities.html)


•    Price Trends
•    Volume:
•    Simple Moving Average (SMA)
•    Weighted and Exponential Moving Averages
•    Resistance & Support

Support is the point level from where from the stock price cannot fall beyond that level whereas Resistance means from where the stock prices cannot move up further. Support level is the buying opportunity for the traders whereas the resistance level is selling opportunity for the traders.

Differences:


1.Fundamental analysis the current market price is one of the inputs but in technical analysis Prices and their movements are important

2.Fundamental analysis is mostly used by the long-term investors but the technical analysis is used by both long-term and short-term investors.

3.Fundamental analysis is not involved in market prediction but for technical analysis market prediction Is sole purpose

4.Fundamental analysis stock bought when the Market value of the stock is less than the intrinsic value of the shares but in technical analysis stock bought when the technical indicators show the buying signal.

It is absolutely your decision to choose between the fundamental analysis and technical analysis. But in my opinion smart investors always look for both combinations.  The first analysis the fundamental strength of the stock then if the fundamental strength is good then they move to technical analysis and take the final call whether to buy stock or not to buy stock or not.

Thursday, 5 July 2018

Top Mutual Funds for SIP to Invest In 2018

For the last couple of years, the popularity of SIPs or Systematic Investment Plans has gone up. Still, many investors including those who have already invested in mutual funds are often confused about SIPs. If you are planning to invest a fixed amount regularly in a mutual fund schemes, typically an equity mutual fund scheme then the Systematic Investment Plans allow you to do that. If you don’t have any knowledge of the market or don’t have time to monitor the market regularly then you should always opt for Systematic Investment Plans. Because SIP puts an end to all the difficulties that investors may face. The money is automatically invested monthly in a scheme without any effort on your part. If you invest in Systematic Investment Plans regularly over a period irrespective of the market conditions, you would get more units when the market is low and fewer units when the market is high. This averages out the purchase cost of your mutual fund units.


ICICI Prudential Focused Bluechip Equity Fund


It is an open-ended equity plan which aims for growth of the capital.  The fund is mainly invested in equity and equity-related securities of large-cap companies to generate long-term capital appreciation and income distribution to investors from a portfolio. It is a top-rated equity mutual fund offered by one of India’s leading AMC, ICICI Prudential Mutual Fund. The performance of this fund has been nothing short of astronomical, which makes it one of the most popular equity mutual fund investments in India.


•    Scheme Type: Open ended scheme
•    Fund Manager:  Sankaran Naren / Rajat Chandak
•    Minimum Investment: Rs.100
•    Entry Load: NA
•    Exit Load: 1.00%
•    NAV as on 18th May 2018 = Rs. 39.62


Growth (Present) %

•    1 Month: - 1.39%
•    3 Months: - 2.54%
•    6 Months: - 3.3%
•    1 Year: - 11.07%
•    3 Years: - 11.14%
•    5 Years: - 17.08%


Aditya Birla Sun Life Banking & Financial Services Fund


The Primary objective of the Aditya Birla Sun Life Banking & Financial Services Fund is to generate long-term capital appreciation to unit holders from a portfolio that is invested mainly in equity and equity-related securities of companies involved in banking and financial services. This fund would invest in banks as well as insurance companies, broking companies, NBFC's, rating agencies, etc. This particular mutual fund scheme is suitable for those investors who are seeking Long-term capital growth and Investments in equity and equity-related securities of companies engaged in banking and financial services.


•    Scheme Type: Open ended scheme
•    Fund Manager:  Mr Satyabrata Mohanty & Mr Dhaval Gala
•    Minimum Investment: Rs.1000
•    Entry Load: NA
•    Exit Load: 1.00%
•    NAV as on 3rd July 2018 = Rs. 27.52 


Growth (Present) %

•    1 Month: - 1.92%
•    3 Months: - 2.72%
•    6 Months: - 0.9%
•    1 Year: - 8.60%
•    3 Years: - 16.79%


L&T Midcap Fund


The main aim of this mutual fund is to generate capital appreciation by investing primarily in mid-cap stocks. It is recommended for all the SIP investors to add this mutual fund in their portfolio to avail the maximum return. This fund would generally comprise of companies that have a market capitalisation ranging from Rs 300 to Rs 3000 crore.


•    Scheme Type: Open ended scheme
•    Fund Manager:  S. N. Lahiri / Vihang Naik
•    Minimum Investment: Rs.500
•    Entry Load: NA
•    Exit Load: 1.00%
•    NAV as on 5th July 2018 = Rs. 135.97


Growth (Present) %

•    1 Month: - 0.63%
•    3 Months: - 5.12%
•    6 Months: - 12.6%
•    1 Year: - 3.48%
•   3 Years: - 15.79%
•    5 Years: - 29.11


Franklin Asian Equity Fund Growth


Franklin Asian Equity Fund-Growth scheme’s main aims to accomplish capital appreciation through investment in Asian companies, excluding Japan, which have high growth potential. This fund gives investors an entrée to a portfolio of quality companies in the Asian region that are well placed to take advantage of the long-term growth potential. If you expect the economy to grow at 9% then you can assume top-performing mutual funds to give you returns in excess of 16%.


•    Scheme Type: Open ended scheme
•    Fund Manager:  Roshi Jain
•    Minimum Investment: Rs.500
•    Entry Load: NA
•    Exit Load: 1.00%
•    NAV as on 5th July 2018 = Rs. 21.7952


Growth (Present) %

•    1 Month: - 5.91%
•    3 Months: - 1.38%
•    6 Months: - 5.22%
•    1 Year: - 11.27%
•    3 Years: - 9.63%
•    5 Years: - 9.83


Mirae Asset Emerging Bluechip Growth


The main objective of the scheme is to make income and capital appreciation from a portfolio mainly investing in Indian equities and equity-related securities of large-cap and mid-cap companies at the time of investment. If you are looking for long-term investment then this fund will be the best option for you. Try to hold this fund for at least 5 years it will give you the highest return. This fund has higher volatility (ups and downs) than other equity funds but can produce much better returns.


•    Scheme Type: Open ended scheme
•    Fund Manager:  Neelesh Surana
•    Minimum Investment: Rs.1000
•    Entry Load: NA
•    Exit Load: 1.00%
•    NAV as on 5th July 2018 = Rs. 47.66

Growth (Present) %

•    1 Month: - 1.1%
•    3 Months: - 0.7%
•    6 Months: - 10.1%
•    1 Year: - 4.4%
•    3 Years: - 16.3%
•    5 Years: - 30.3


These are the best mutual funds for SIP you can invest in this year. You can also look my other blog https://investmenttipstoday.blogspot.com/2018/05/my-best-mutual-funds-2018.html for more mutual fund options.

Wednesday, 27 June 2018

Bank Fixed Deposit Rates 2018


Investing in bank deposits is always risk-free. Bank offers moderate returns enough to cover inflation rate. I am here trying to help you to choose best possible schemes for you. If you want to invest in risk-free fixed deposit schemes, then you have to be very careful about the non-banking fixed deposit schemes, because these schemes carry market and credit risk.


The rate of interest depends on the amount you want to deposits, the tenure of deposits and type of depositor you are.


•    Banks in India offer a higher interest rate on fixed deposits to the senior citizens.

•    The rate of interest also depends on the tenure. Banks offer higher interest rates to the long-term depositors whereas lower interest rates to the short term depositors.

•    Banks also offer lower interest rates to the bulk depositors who deposit more than 1 crore and highest interest rate to the depositors who invest less than 1 crore.

•    The period of a fixed deposit may vary from as short as 1 day to 10 years.

•    Fixed deposits can be opened by all residents in India,  including minors and HUFs

•    2 nominees are allowed per account.

•    You can’t withdraw your money unless you tenure period matured. But you can withdraw your money if you need for emergency purposes by paying penalty.

•    You are also allowed to take a loan to the extent 75% to 95% of your fixed deposited amount which varies from one lender to another.

•    Fixed deposits are entitled to TDS if they get an interest of more than Rs.10,000 in a year.

•    Fixed deposit schemes also provide tax relief to the depositors. You can choose for tax saving fixed deposits and invest up to 1.5 lakhs to save your income tax.


What is a fixed deposit?


When a depositor invests lump sum money into a bank for a fixed tenure at a fixed rate of interest is called fixed deposit. Money is invested only once at the time of fixed deposit account opening. At the time of maturity, the interest rate is calculated on the principal amount invested and the total invested money plus interest is paid back to the depositor cumulatively. Fixed deposit schemes always provide a higher return than the regular savings bank account. Fixed deposits are also known as term deposits.

Who should invest in fixed deposits?


If you don’t want to take a risk by investing money in shares or mutual funds than fixed deposit option is ideal for you. A fixed deposit ensures capital protection as well as a uniform flow of income.


Fixed Deposit interest rate calculator:


A = P * (1+ r/n) ^ n*t

I = A – P

A = Maturity value

P = Principal amount

r = rate of interest

t = Number of years

n = Compounded interest frequency

I = Interest earned the amount


Main advantages of Fixed Deposit:


•   Offers guaranteed returns:


Fixed deposits schemes offer guaranteed return. The main reason behind this, it doesn’t get affected due to market fluctuation.  Fixed deposits are low-risk investments they offer a much healthier rate of interest than savings accounts.


•    Fixed Rate of Interest


Fixed deposits schemes offer a fixed rate of interest. The rate of interest for the period that your investment is locked in remains fixed, regardless of any changes or notifications. Your investment remains fixed at the same rate that you have invested, even though the rate of interest can be revised on a yearly basis.


•    Source of Emergency Funds


Fixed deposits can be withdrawn, anytime even in between the term period because of the liquidity. It is beneficial to use in emergencies, you can also borrow money against your fixed deposit, and banks allow loans of up to 90% of the amount deposited.


•    Tax Benefit


Now investors can avail tax benefits on their fixed deposits. As per the current budget, the senior citizens now get more deductions on Fixed Deposits interest earnings. It was tax-free only up to Rs. 10,000 earlier but now it has been raised to Rs.50,000. For a company, the return of the fixed deposit is tax-free up to Rs. 5,000 a year.


Few disadvantages are also there in fixed deposits:


•    Low Return


Fixed deposit return seems very low as it is more secure than the other investment schemes. As we all know “high-risk high return and low-risk low return” it follows the same rule. It affects mainly due to inflation if the inflation is very high fixed deposit investors are the worst hit as the return from fixed deposit may not be enough to cover the high costs due to inflation.


•    No Diversification


Investors don’t enjoy the benefits of diversification if he or she invests his/her money into fixed deposits.  One can get a higher return if he or she invests their money into various investment schemes like the stock market, mutual funds, bonds, gold or in any other alternative investment schemes.

Now Interest rates of different banks:


Bank
FD Tenure
Interest Rates (%)
Regular Citizens
Senior Citizens
State Bank of India
7 to 10 Years
5.75 to 6.75
6.25 to 7.25
HDFC
7 to 10 Years
3.50 to 6.00
4.00 to 6.50
ICICI
7 to 10 Years
4.00 to 6.75
4.50 to 7.25
Bank of Baroda
7 to 10 Years
4.25 to 6.70
4.75 to 7.20
Axis Bank
7 to 10 Years
3.50 to 7.40
3.50 to 8.05
IDFC
7 to 10 Years
4.00 to 7.75
4.50 to 8.75
Bank of India
7 to 10 Years
5.25 to 6.50
5.25 to 7.00
Canara Bank
7 to 10 Years
4.20 to 7.00
4.70 to 7.50
Central Bank of India
7 to 10 Years
4.75 to 6.60
5.25 to 7.00
Dena Bank
7 to 10 Years
4.00 to 6.60
4.00 to 7.10
United Bank of India
7 to 10 Years
4.00 to 6.10
4.00 to 6.50
Bandhan Bank
7 to 10 Years
3.50 to 7.40
4.25 to 8.15
Karur Vysya Bank
7 to 10 Years
5.00 to 7.00
5.00 to 7.50
LIC Housing Finance
7 to 10 Years
7.30 to 7.45
7.55 to 7.70
Syndicate Bank
7 to 10 Years
4.75 to 6.80
5.25 to 7.30
RBL
7 to 10 Years
5.00 to 7.35
5.50 to 7.85
Corporation Bank
7 to 10 Years
4.50 to 6.80
         to 7.30
Kotak
7 to 10 Years
3.50 to 7.20
4.00 to 7.70
IDFC
7 to 10 Years
4.00 to 7.75
4.50 to 8.75
Citi Bank
7 to 10 Years
3.00 to 6.50
         to 7.00
Federal Bank
7 to 10 Years
3.50 to 7.30
4.00 to 7.80
HSBC
7 to 10 Years
3.00 to 6.25
3.50 to 6.75
Standard Chartered Bank
7 to 10 Years
4.25 to 7.25
5.00 to 7.75
Yes Bank
7 to 10 Years
5.00 to 7.10
5.50 to 7.60

Monday, 21 May 2018

My Best Mutual Funds 2018

I am investing in best mutual funds 2018 after doing a market research based on the present economy and performance of the mutual funds. I am also sharing with you about the mutual funds where I am investing this year. These will definitely give me a good return without taking much risk.

1. SBI Blue Chip Fund - Growth


Bluechip companies are all large companies, with significant market share & leadership in their relevant industries. They already have shown positive growth, good credit ratings and better brand equity amongst the public. Investing in such companies brings relative reliability to your portfolio.
This fund provides the opportunities for long-term growth in capital through a dynamic management of investments in a diversified basket of equity stocks of companies whose market capitalization is equal to or more than the least market capitalised stock of S&P BSE 100 Index. This fund is suitable for those investors who are looking for medium to long-term perspective.

The minimum investment amount required for a lump sum is Rs.5000, while for SBI Bluechip fund SIPs the minimum amount to be invested is Rs.1000 only.

•    Scheme Type: Open ended scheme
•    Fund Manager: Sohini Andani
•    Lock-In Period:    0
•    Entry Load: Nil
•    Exit Load: 1%
•    NAV as on 10th May 2018 = Rs 38.6820

Growth (Present) %
•    1 Week: -0.31%
•    1 Month: - 0.52%
•    3 Months: - 2.77%
•    6 Months: - 2.80%
•    1 Year: - 11.46%
•    3 Years: - 41.55%
•    5 Years: - 124.82%

2. HDFC Balanced Fund – Growth


It is one of the best mutual funds for investment in India.  This mutual fund is a regular performer in the mutual fund industry for a long time and has returned bigger profits to the investors. The main aim of this mutual fund is to provide capital growth and stable income so as to ensure financial soundness for the investors. This fund is best for the investors who are seeking financial stability and high growth of investments in the long-term.

The minimum investment amount required for a lump sum is Rs.5000, while for HDFC Balanced Fund SIPs the minimum amount to be invested is Rs.500 only.
•    Scheme Type: Open ended scheme
•    Fund Manager:    Chirag Setalvad
•    Lock-In Period:    0
•    Entry Load: NIL
•    Exit Load: Applicable
•    NAV as on 10th May 2018 = Rs 149.2410

Growth (Present) %
•    1 Week: -0.25%
•    1 Month: - 0.16%
•    3 Months: - 0.06%
•    6 Months: - 0.61%
•    1 Year: - 10.18%
•    3 Years: - 42.21%
•    5 Years: - 137.45%

3. Reliance Equity Hybrid Fund-Direct Plan – Growth


The main investment objective of this fund is to make steady return and appreciation of capital by investing in a mix of securities comprising of equity, equity related instruments and fixed income instruments. This fund was formerly known as “Reliance Regular Savings Fund - Balanced Option”. This fund is suitable for those who are seeking long-term capital growth and investment in equity.
Investment up to 50 percent of its assets in equities and equity-related securities and at least 25 percent of its assets in debt and money market instruments with an average maturity of 1 to 7 years.
Minimum Investment: Rs.500

•    Scheme Type: Open ended scheme
•    Entry Load: Nil
•    Exit Load: 1%
•    Fund Manager:    Sanjay Parekh & Mr. Amit Tripathi
Growth (Present) %
•    1 Week: -
•    1 Month: - 0.9%
•    3 Months: - 0.5%
•    6 Months: - 2.8%
•    1 Year: - 11.9%
•    3 Years: - 12.2%
•    5 Years: - 16.8% 

4. Axis Long Term Equity Fund (Growth)


Generating regular long-term capital growth from a diversified portfolio of equity and equity-related securities is the main aim of this fund. It invests in equity and equity-linked instruments such that it features a high degree of growth with the possibility of producing high returns to those investing the Axis Long-Term Equity Fund scheme.

This fund is designed to offer subscribers with tax savings benefits under section 80C of the IT Act 1961.

•    Scheme Type:  Open ended scheme
•    Fund Manager:    Jinesh Gopani
•    Entry Load: Nil
•    Exit Load: Nil
•    Minimum investment: Rs.500
•    Lock-In Period: 3 Years
•    NAV as on 16 May 2018: Rs 43.0670

Growth (Present) %
•    1 Week: -  0.67%
•    1 Month: - 1.48%
•    3 Months: - 6.13%
•    6 Months: - 10.12%
•    1 Year: - 18.63%
•    3 Years: - 12.17%
•    5 Years: - 22.73%

5. L&T Emerging Businesses Fund – Growth


The main aim of this open-ended fund is to generate long-term capital appreciation from a diversified portfolio of mainly equity and equity-related securities, including equity derivatives. This fund mainly invests in the small-cap stocks (emerging companies). Additionally, this fund also invests in Foreign Securities. Emerging companies are the companies those businesses which are typically in the early stage of development. They have the perspective to grow their revenues and profits at a higher rate as compared to the broader market. There is no guarantee that the Scheme will be realised and the Scheme does not assure or promise any returns.

•    Scheme Type: Open ended scheme
•    Fund Manager:    Soumendra Nath Lahir
•    Entry Load: NIL
•    Exit Load: NIL if purchased during the NFO period and during the 2 year period from the date of allotment.
•    Minimum Investment: Rs.5000
•    NAV as on 18 May 2018: Rs 27.52

Growth (Present) %
•    1 Week: -  0.77%
•    1 Month: - 1.75%
•    3 Months: - 1.03%
•    6 Months: - 3.94%
•    1 Year: - 18.31%
•    2 Year: 35.3%
•    3 Years: - 25.66%

6. Franklin India Smaller Companies Fund - Growth


It is an open-ended equity fund from Franklin Templeton Mutual Fund. As a predominant small-cap fund, it grasps a major portion of its investment in small caps and mid-caps along with a nominal portion into large caps. This makes appropriate for investors looking to boost of extraordinary returns generated by small caps. This fund is well known for strong investment processes, smart stock picking and sound risk management.

•    Scheme Type: Open ended scheme
•    Fund Manager:  R Janakiraman
•    Minimum Investment: Rs.5000
•    Entry Load: 1%
•    Exit Load: NIL
•    NAV as on 18th May 2018 = Rs.60.00

Growth (Present) %
•    1 Month: - 0.9%
•    3 Months: - 0.5%
•    6 Months: - 1.9%
•    1 Year: - 12%
•    2 Year: 20.9%
•    3 Years: - 16%
•    5 Years: - 28.8%

These are the mutual funds that I am looking to invest in this year. After study and research, I have found that these funds will provide me greater return in the near future.

Tuesday, 8 May 2018

Trading Tips and Ideas Using Bearish Candlestick Patterns – Reversal

In my previous blog, I have discussed the important bullish candlesticks reversal pattern for identifying buying points. Now here I am going to discuss the main bearish reversal patterns for selling your stocks. To maximize your return from stock market you have to learn bearish patterns as long with bullish patterns.

•    Gravestone Doji: 


Gravestone Doji


It is a bearish candlestick and is similar to that of a gravestone. This type of candlestick can be found in an uptrend but it’s usually found in a bullish trend that’s about to reverse. This candlestick is formed when the open and close price of a bar is equal or almost equal and also open and close very near the low of the bar. The high of the day forms the long shadow and the long upper wick conveys you the bulls had control during the day. After that, the bears came in and drove the price back down to end the day.
-Opening, closing and minimum prices are the same or very similar
-Long upper shadow
-Appears on as a long line

•    Hanging Man:


Hanging Man


It has its name because of its similarity to the hanging dead man. It may also mean that if you do not act upon this signal and still holding your position, then you are a dead man. It is a bearish signal and appears in an uptrend and cautions of a possible trend reversal. The long lower shadow of the hanging man is usually a bullish signal, showing that demand for the underlying security forced the price into the upper third of the price range for that period. For this reason, confirmation of a trend reversal is should be required. After that, the candlestick following the hanging man should close below the real body of the hanging man.

•    Shooting Star: 


Shooting Star


Shooting star is look like almost inverted hammer in appearance.  This bearish candlestick pattern is composed of a single candle. The open, close, and low are near the low of the candlestick.

-    Small body candle either red (black) or green (white)
-    Shadow cannot be longer than the body
-    Upper shadow must be 2 times greater than the body 
-    Gap in either opening or closing makes this signal much stronger
-    Appears in uptrend

It indicates when it appears in the uptrend that the price has reached at the maximum of its current uptrend and will soon start falling. Mainly, the bulls were in command, pushing the prices higher. The bulls continued pushing higher after the market open, but then the bears marched in. The price was driven back to the down, and it closed near its beginning point.

•    Bearish Engulfing: 


Bearish Engulfing


The bearish engulfing candlestick pattern specifies a bearish move ahead. It usually forms at uptrend and directs that bears are no trying to take control from bulls. It is stronger if it gets formed at any prevalent strong resistance zones. It is mainly composed of two candles. It can be identified by a large red (black candle) engulfing the previous bullish green (white) at the uptrend. The red candlestick started to form when buying pressure force to open the stock price above the previous close. Later the seller steps up and forces to close the stock price below the previous open for a potential reversal. Wait for the next day signal. If it’s bearish then go for selling that stock.

•    Identical Three Crows:


Identical Three Crows

In an uptrend, it signals the continuation of the bearish trend in the same direction.  If we compare with other bearish reversal patterns this signal is not strong enough. The two candlesticks next to the first candlestick close at lower prices than the previous ones. Three significant, consecutive and boosting red (black) candlesticks encompass this formation. The former candlestick paves the way for the new successive candlestick.

•    Darkcloud Cover:


Darkcloud Cover


It is a simple and very effective candlestick pattern to look for when trading short-term up and down swings within a price channel. This bearish reversal pattern appears at the end of a uptrend. The first candlestick must be a green (white) candlestick with a large real body and the second candlestick should be red (black) and should below the above of the preceding candlestick. The last candlestick must be closing below the middle of the real body of the first candlestick, with the deeper it pierces the first candlestick the more substantial the pattern becomes. Traders also need this to form in context with another bearish trade setup as trade confirmation.

•    Bearish Harami Cross:


Bearish Harami Cross


This bearish reversal candlestick pattern also appears in the uptrend. The previous candlestick must be green or white and the very next candlestick must be a doji. The low of the Doji must be lower than the open of the previous candle. The low of the Doji must be lower than the close of the previous candle. When a Bearish Harami Cross candlestick pattern is recognized after a bullish move, it can signal a reversal in the price action.

•    Abandoned Baby Top:


The Bearish Abandoned Baby or Abandoned Baby Top is a bearish candlestick pattern that helps traders to identify a reversal in a bullish price action. This bearish pattern is opposite of the bullish abandoned baby pattern. This candlestick pattern is formed by three specific candlesticks that meet the following qualifications:

-    The first candlestick must be a bullish green candlestick located at the top of a uptrend.
-    The second candlestick must be a small-bodied candle, sometimes a dojo that gaps above the close of the first candlestick.
-    The third next candlestick is a large bearish red or black candlestick that opens below the second and generally closes around where the first candlestick opened. This particular candlestick identifies the change in the price trend.

These are the main bearish reversal patterns. You can always use this signals for trading either for short term or long term. Always compare these patterns with RSI (Relative Strength Index) and use a stop loss to become a successful investor.

For bullish reversal patterns please visit my blog - Candlestick Patterns Explained with Examples – Bullish Reversal Patterns