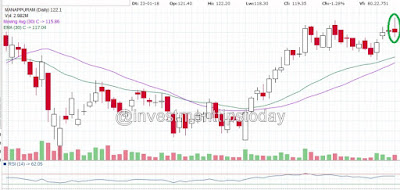
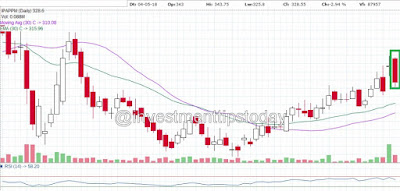
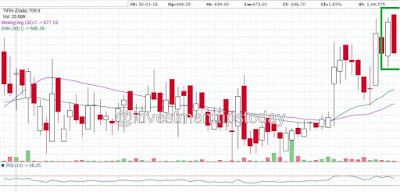
In my previous blog, I have discussed the important bullish candlesticks reversal pattern for identifying buying points. Now here I am going to discuss the main bearish reversal patterns for selling your stocks. To maximize your return from stock market you have to learn bearish patterns as long with bullish patterns.
It is a bearish candlestick and is similar to that of a gravestone. This type of candlestick can be found in an uptrend but it’s usually found in a bullish trend that’s about to reverse. This candlestick is formed when the open and close price of a bar is equal or almost equal and also open and close very near the low of the bar. The high of the day forms the long shadow and the long upper wick conveys you the bulls had control during the day. After that, the bears came in and drove the price back down to end the day.
-Opening, closing and minimum prices are the same or very similar
-Long upper shadow
-Appears on as a long line
It has its name because of its similarity to the hanging dead man. It may also mean that if you do not act upon this signal and still holding your position, then you are a dead man. It is a bearish signal and appears in an uptrend and cautions of a possible trend reversal. The long lower shadow of the hanging man is usually a bullish signal, showing that demand for the underlying security forced the price into the upper third of the price range for that period. For this reason, confirmation of a trend reversal is should be required. After that, the candlestick following the hanging man should close below the real body of the hanging man.
Shooting star is look like almost inverted hammer in appearance. This bearish candlestick pattern is composed of a single candle. The open, close, and low are near the low of the candlestick.
- Small body candle either red (black) or green (white)
- Shadow cannot be longer than the body
- Upper shadow must be 2 times greater than the body
- Gap in either opening or closing makes this signal much stronger
- Appears in uptrend
It indicates when it appears in the uptrend that the price has reached at the maximum of its current uptrend and will soon start falling. Mainly, the bulls were in command, pushing the prices higher. The bulls continued pushing higher after the market open, but then the bears marched in. The price was driven back to the down, and it closed near its beginning point.
The bearish engulfing candlestick pattern specifies a bearish move ahead. It usually forms at uptrend and directs that bears are no trying to take control from bulls. It is stronger if it gets formed at any prevalent strong resistance zones. It is mainly composed of two candles. It can be identified by a large red (black candle) engulfing the previous bullish green (white) at the uptrend. The red candlestick started to form when buying pressure force to open the stock price above the previous close. Later the seller steps up and forces to close the stock price below the previous open for a potential reversal. Wait for the next day signal. If it’s bearish then go for selling that stock.
The Bearish Abandoned Baby or Abandoned Baby Top is a bearish candlestick pattern that helps traders to identify a reversal in a bullish price action. This bearish pattern is opposite of the bullish abandoned baby pattern. This candlestick pattern is formed by three specific candlesticks that meet the following qualifications:
- The first candlestick must be a bullish green candlestick located at the top of a uptrend.
- The second candlestick must be a small-bodied candle, sometimes a dojo that gaps above the close of the first candlestick.
- The third next candlestick is a large bearish red or black candlestick that opens below the second and generally closes around where the first candlestick opened. This particular candlestick identifies the change in the price trend.
These are the main bearish reversal patterns. You can always use this signals for trading either for short term or long term. Always compare these patterns with RSI (Relative Strength Index) and use a stop loss to become a successful investor.
For bullish reversal patterns please visit my blog - Candlestick Patterns Explained with Examples – Bullish Reversal Patterns
• Gravestone Doji:
It is a bearish candlestick and is similar to that of a gravestone. This type of candlestick can be found in an uptrend but it’s usually found in a bullish trend that’s about to reverse. This candlestick is formed when the open and close price of a bar is equal or almost equal and also open and close very near the low of the bar. The high of the day forms the long shadow and the long upper wick conveys you the bulls had control during the day. After that, the bears came in and drove the price back down to end the day.
-Opening, closing and minimum prices are the same or very similar
-Long upper shadow
-Appears on as a long line
• Hanging Man:
It has its name because of its similarity to the hanging dead man. It may also mean that if you do not act upon this signal and still holding your position, then you are a dead man. It is a bearish signal and appears in an uptrend and cautions of a possible trend reversal. The long lower shadow of the hanging man is usually a bullish signal, showing that demand for the underlying security forced the price into the upper third of the price range for that period. For this reason, confirmation of a trend reversal is should be required. After that, the candlestick following the hanging man should close below the real body of the hanging man.
• Shooting Star:
Shooting star is look like almost inverted hammer in appearance. This bearish candlestick pattern is composed of a single candle. The open, close, and low are near the low of the candlestick.
- Small body candle either red (black) or green (white)
- Shadow cannot be longer than the body
- Upper shadow must be 2 times greater than the body
- Gap in either opening or closing makes this signal much stronger
- Appears in uptrend
It indicates when it appears in the uptrend that the price has reached at the maximum of its current uptrend and will soon start falling. Mainly, the bulls were in command, pushing the prices higher. The bulls continued pushing higher after the market open, but then the bears marched in. The price was driven back to the down, and it closed near its beginning point.
• Bearish Engulfing:
The bearish engulfing candlestick pattern specifies a bearish move ahead. It usually forms at uptrend and directs that bears are no trying to take control from bulls. It is stronger if it gets formed at any prevalent strong resistance zones. It is mainly composed of two candles. It can be identified by a large red (black candle) engulfing the previous bullish green (white) at the uptrend. The red candlestick started to form when buying pressure force to open the stock price above the previous close. Later the seller steps up and forces to close the stock price below the previous open for a potential reversal. Wait for the next day signal. If it’s bearish then go for selling that stock.
• Identical Three Crows:
In an uptrend, it signals the continuation of the bearish trend in the same direction. If we compare with other bearish reversal patterns this signal is not strong enough. The two candlesticks next to the first candlestick close at lower prices than the previous ones. Three significant, consecutive and boosting red (black) candlesticks encompass this formation. The former candlestick paves the way for the new successive candlestick.
• Darkcloud Cover:
It is a simple and very effective candlestick pattern to look for when trading short-term up and down swings within a price channel. This bearish reversal pattern appears at the end of a uptrend. The first candlestick must be a green (white) candlestick with a large real body and the second candlestick should be red (black) and should below the above of the preceding candlestick. The last candlestick must be closing below the middle of the real body of the first candlestick, with the deeper it pierces the first candlestick the more substantial the pattern becomes. Traders also need this to form in context with another bearish trade setup as trade confirmation.
• Bearish Harami Cross:
This bearish reversal candlestick pattern also appears in the uptrend. The previous candlestick must be green or white and the very next candlestick must be a doji. The low of the Doji must be lower than the open of the previous candle. The low of the Doji must be lower than the close of the previous candle. When a Bearish Harami Cross candlestick pattern is recognized after a bullish move, it can signal a reversal in the price action.
• Abandoned Baby Top:
The Bearish Abandoned Baby or Abandoned Baby Top is a bearish candlestick pattern that helps traders to identify a reversal in a bullish price action. This bearish pattern is opposite of the bullish abandoned baby pattern. This candlestick pattern is formed by three specific candlesticks that meet the following qualifications:
- The first candlestick must be a bullish green candlestick located at the top of a uptrend.
- The second candlestick must be a small-bodied candle, sometimes a dojo that gaps above the close of the first candlestick.
- The third next candlestick is a large bearish red or black candlestick that opens below the second and generally closes around where the first candlestick opened. This particular candlestick identifies the change in the price trend.
These are the main bearish reversal patterns. You can always use this signals for trading either for short term or long term. Always compare these patterns with RSI (Relative Strength Index) and use a stop loss to become a successful investor.
For bullish reversal patterns please visit my blog - Candlestick Patterns Explained with Examples – Bullish Reversal Patterns


Japanese traders have found that candlesticks form interesting patterns
ReplyDeletein the seeming market chaos.
These candlestick patterns are LEADING indicators and they can be used to
make a profit if used correctly and effectively.
The "Forex Candlestick Tactics" ebook reveals powerful methods to trade
candlestick patterns combined with standard technical indicators. Check
out what's inside:
http://www.forexmystery.com?hs4dg4sdfh