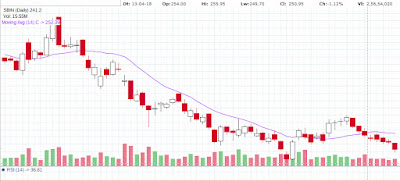
Technical analysis started out with pretty simple concepts. Formerly, it was about looking for directional trends in prices and divergences between related market indexes. When the stock prices start moving in one direction either upper or lower, then they are more likely to follow that trend than to reverse. Technical analysis was just a way to visualize this perception.
When I started to trade in the market, I usually rely on the market moves driven by the news. But frankly speaking, I never made money after following this approach. But when I am started to learn and follow technical analysis I started to gain from the market.
I have discussed few basics below about Technical Analysis which would help you to understand and trade in the market:
Price Trends:
Price Trends indicates the current direction of share prices. Is the price of the stocks moving upper or lower? How long has it been doing so? If the stock prices continue to rise higher, it is considered to be in an uptrend and when the stock prices continue to fall it is considered as a downtrend. Uptrend indicates increasing demand for shares, as buyers are willing to pay higher prices as supply diminishes. On the other hand, Downtrend indicates increasing supply of shares when not much buyers are interested to buy the shares. You can generate trend line by connecting the various high and low points on a chart. Now from this generated trend line, you can pinpoint support/resistance and direction of stock prices. For better understanding, you can compare your current trend line with the historical trend line of the similar stocks.
 |
| Trendline |
Volume:
Volume tells us how strong the prevailing trend might be. Decreasing volume can be a signal that the trend might be on the edge of a reversal. The number of shares or contracts that traded over a given period is called Volume. Volume is important because it helps us to confirm the reversal trend.
For example:
Suppose stock X is in a downtrend at the moment. If tomorrow it increases 5% high then traders can think the stock’s downtrend is over and they could start accumulating stock X. But for the confirmation traders should always check the volume of the stock on that particular day. If the volume does not increase subsequently then it is not a trend reversal. This might be a fluke.
 |
| Volume |
Moving Averages:
Moving Averages are the most commonly used technical indicators. This indicator helps you to distinguish between typical market fluctuations and actual rate reversals. Moving averages make you easier to spot trends, something that is mainly helpful in volatile markets. They also form the building blocks for numerous other technical indicators and overlays.
Simple Moving Average (SMA)
The Simple Moving Average (SMA) is the most popular type of moving average and it is generated by calculating the average price of a financial market over a chosen period of time. To compute the simple moving average you need to do a fairly basic calculation. Firstly, you need to add a stock's closing prices over a set number of days, and then divide the addition by the total number of days. For example, stock X’s closing prices for 14 days –250, 240, 245, 242, 247, 255, 251, 260, 254, 262, 270, 280, 269, 271 respectively.
So the moving average is = (250 + 240 + 245 + 242 + 247 + 255 + 251 + 260 + 254 + 262 + 270 + 280 + 269 + 271/14) = 256.86
It indicates if the stock X stays above 256.85 then it can be considered as positive sign in short term say for 14 says.
With every new day, the latest closing price replaces the oldest closing price in the calculation.
 |
| Simple Moving Average |
• Moving averages help in the smoothing out of price action.
• Moving averages are used not only to recognize the direction of the stock’s price trend but also for trade entry.
Weighted and Exponential Moving Averages
Weighted and exponential moving averages give greater significance to a stock's most recent closing prices rather than Simple Moving Averages. Calculation of weighted moving average is almost similar with simple moving average calculation. Heavier weightings are allocated to the utmost recent closing prices in the data set to confirm the moving average replicates recent trends and fluctuations.
Simple Moving Average VS Exponential Moving Average
 |
| SMV VS EMA |
Notice how the green line (the 30 EMA) seems to be closer price than the violet line (the 30 SMA). This means that it more exactly represents current price action. You can perhaps guess why this happens. It’s mainly because of the exponential moving average places more importance on what has been trending lately. When trading, it is more important to see what traders are doing present days rather what they were doing last week or last month.
In this blog, I have only discussed few basics things about Technical Analysis. Please follow my future blogs for knowing more about technical analysis and how you can make a profit using this knowledge. My blogs on Relative Stock Index, Candle Stock Analysis are coming soon.....